
The Context
Recently, I was transferred to the new team to help them embrace system Observability and shift to OpenTelemetry for tracing system behavior.
I started Adjusting the first service and added OpenTelemetry Agent to collect traces from auto instrumentations. This was the first step in the instrumentation of this service, but I quickly realized that it was not enough because traces were broken in multiple places. After all, the service heavily relies on the outbox pattern to send events in a transactional manner.
There are no auto instrumentations for such cases, so I needed to write my custom code to add such specific instrumentation, to preserve tracing data while saving outbox messages to the database. I also needed to restore this tracing data on the consumer side.
Creating custom instrumentation using the OpenTelemetry API is a topic for another post, which I think I will write in the future, so stay tuned! :)
Ok, the custom instrumentation has been added, and now it is time to write tests, which will check if it works as expected.
The problem
Tests in this service (let's call this service OrderService; I know it is very original, but I can't share the real name) took a very long time to run, even before my changes. They lasted about 8 minutes, and there were about 1020 of them. Moreover, CPU usage was about 60%, but finally, they passed after 8 minutes.
The problem started when I added more or less 10 new Tests related to my custom tracing instrumentation. Suddenly, tests began to run infinitely, and CPU usage increased from 60% to 90% and more. But they never ended and it was wired.
Why?
I suspect it's like using a coffee machine—you start making coffee, and suddenly, a message pops up: "Grounds tray full." Similarly, in this case, the tests were running slowly but still working—until I added a few new tests and some additional dependencies. That's when the grounds tray overflowed, because I reached the limit.
Investigation
It was a tough issue, and I wasn't quite sure how to approach it. The first thing that caught my eye was that the test configurations frequently included annotations such as:
- @ActiveProfiles
- @Import
- @SpringBean (Spock alternative to mockito @MockBean)
- @ContextConfiguration
- @TestConfiguration
- @ClassRule
These annotations result in the creation of new Spring test contexts.
After adding the property
logging.level.org.springframework.test.context.cache:debug
In the logs, I noticed that there were indeed quite a lot of these contexts, as the missCount was 28. This meant that for all the tests, the Spring context was started and configured 28 times.
18:06:00.585 [Test worker] DEBUG o.springframework.test.context.cache - Spring test ApplicationContext cache statistics: [DefaultContextCache@4322eeba size = 28, maxSize = 32, parentContextCount = 0, hitCount = 3528, missCount = 28]
This already gave me an idea of why the tests were taking so long. However, it didn’t answer the question of why they started running indefinitely and wouldn’t finish.
Maybe Problem with TestContainers?
The tests would always "hang" on one specific test—let's call it SomeKafkaStreamsTestContainerTest. As the name suggests, this test used TestContainers to spin up a Kafka container. Once the container was started, it configured the Spring context and executed the test.
Everything worked fine when the test was run in isolation one by one. However, when all tests were executed together, they would start running indefinitely.
I suspected an issue with the TestContainers configuration, so I moved it to ensure the containers started at the beginning of all tests. However, this didn't help—although now I started getting a timeout from the Kafka client, which was attempting to create topics on the already running Kafka instance (before the problematic test even started).
To address this, I moved the topic creation to the beginning of all tests, right where the Kafka container was started. This resolved the timeout issue, but the hanging test problem persisted.
At this point, I concluded that the issue wasn't with the container configuration—it was something deeper.
More Forks...

Experimentally, I increased the number of JVM forks in the tests to half of my CPU cores and added a timeout.
test {
    useJUnitPlatform()
    maxParallelForks = Runtime.runtime.availableProcessors().intdiv(2)   // 16/2 = 8


    timeout = Duration.ofMinutes(15)
}
And success! Not only do the tests pass, but instead of taking 8 minutes, they now complete in just 45 seconds. 🚀
I just started wondering what it's about, why did it suddenly start working? You'll find out more in the next part :)
Return to 1 fork + attach VisualVM.
However, I decided to return to the standard configuration and find the cause of the problem rather than just covering it up by increasing the number of JVM forks.
To see what exactly was happening, I attached VisualVM to the tests and started observing what was happening and looking for anomalies.
Overview
After attaching VisualVM, I saw this image.
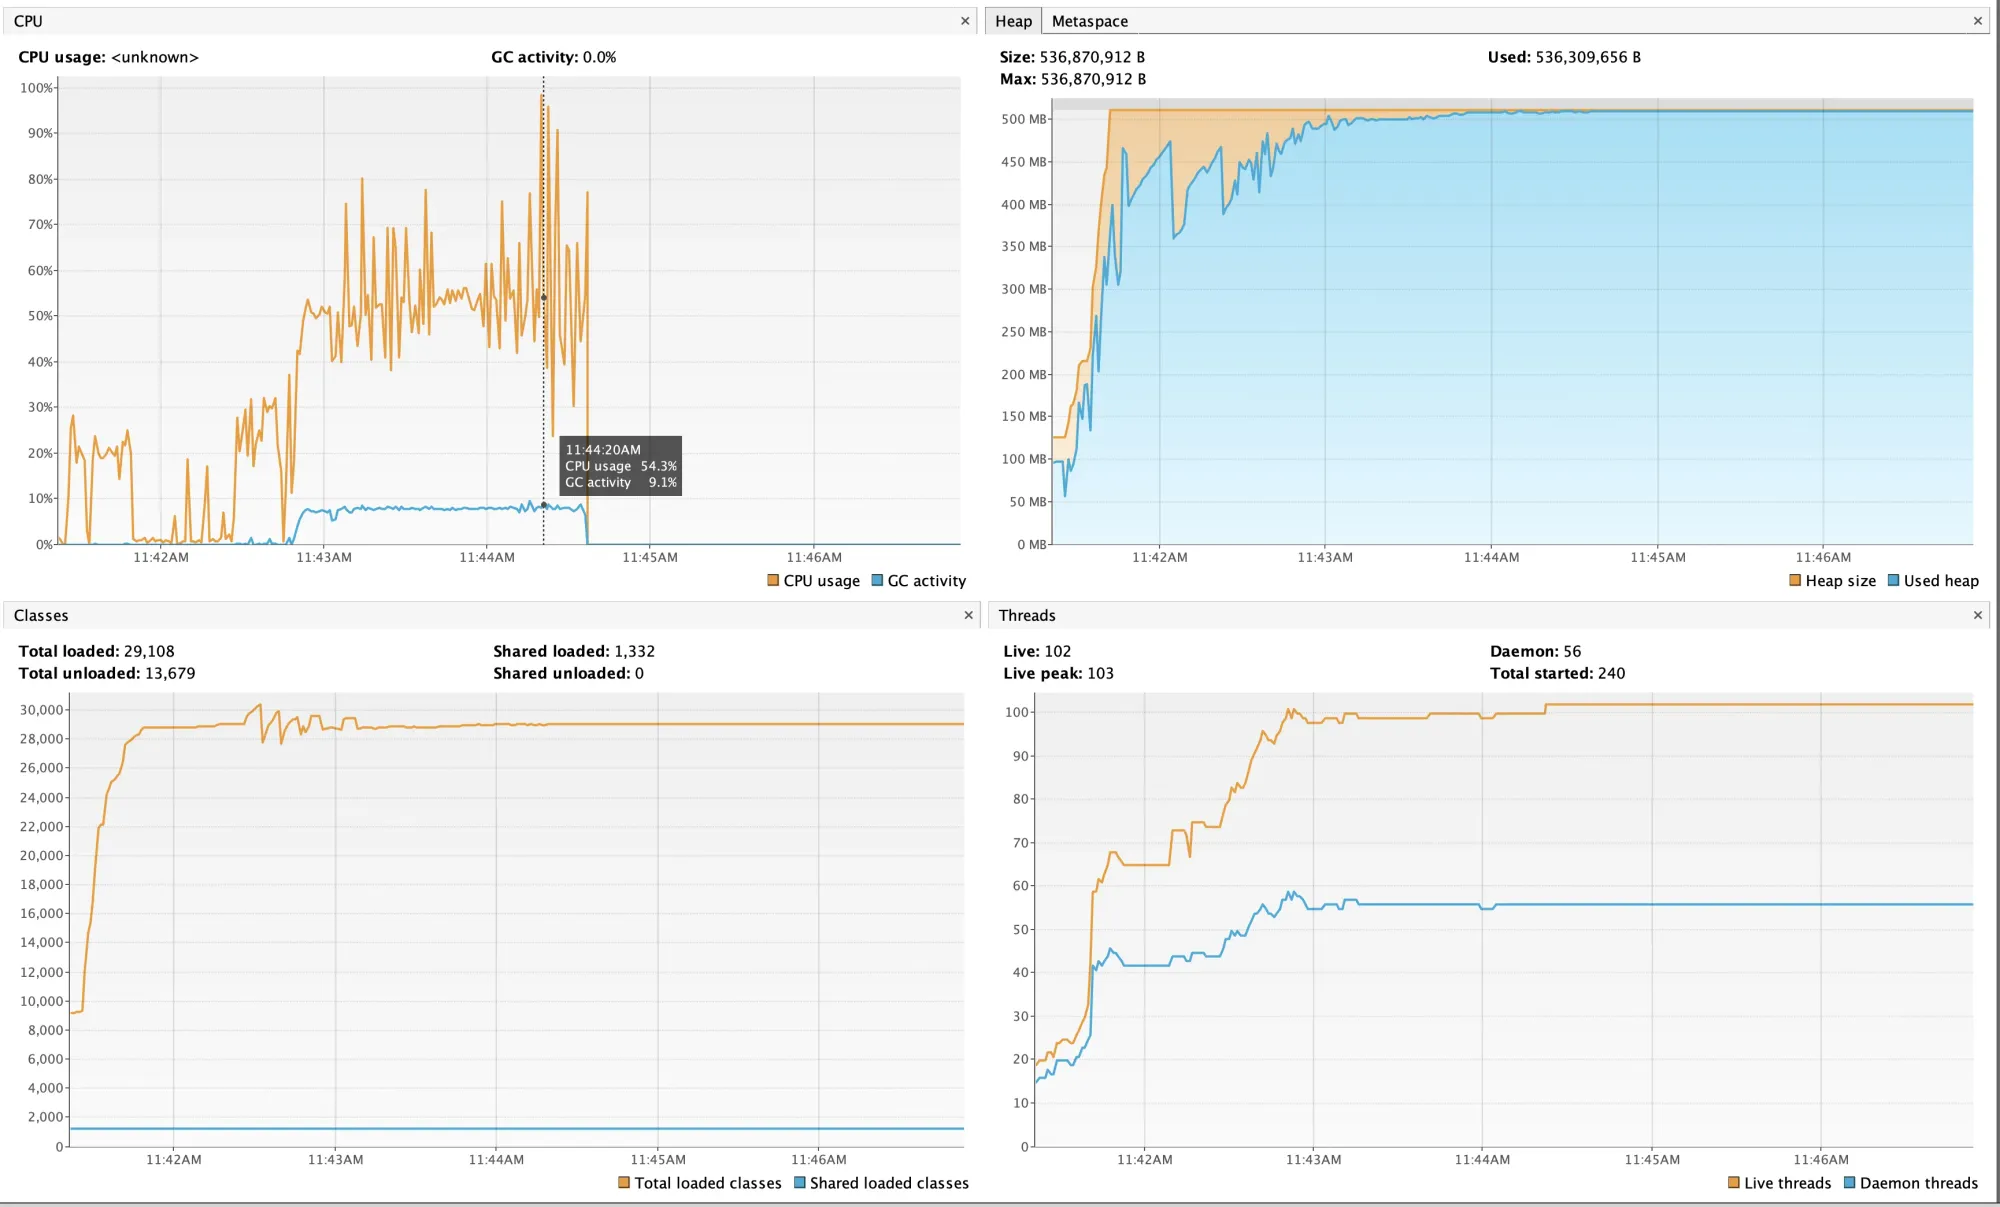
CPU (square at the top left) It shows that the CPU usage is considerable, but more interestingly, the activity of the Garbage Collector is also very high, almost 10%. This already suggests that something might be wrong with the memory.
MEMORY (square at the top right) Here, it's clear that the memory is reaching its limit and is not being freed, which explains the high GC activity mentioned above.
GC details
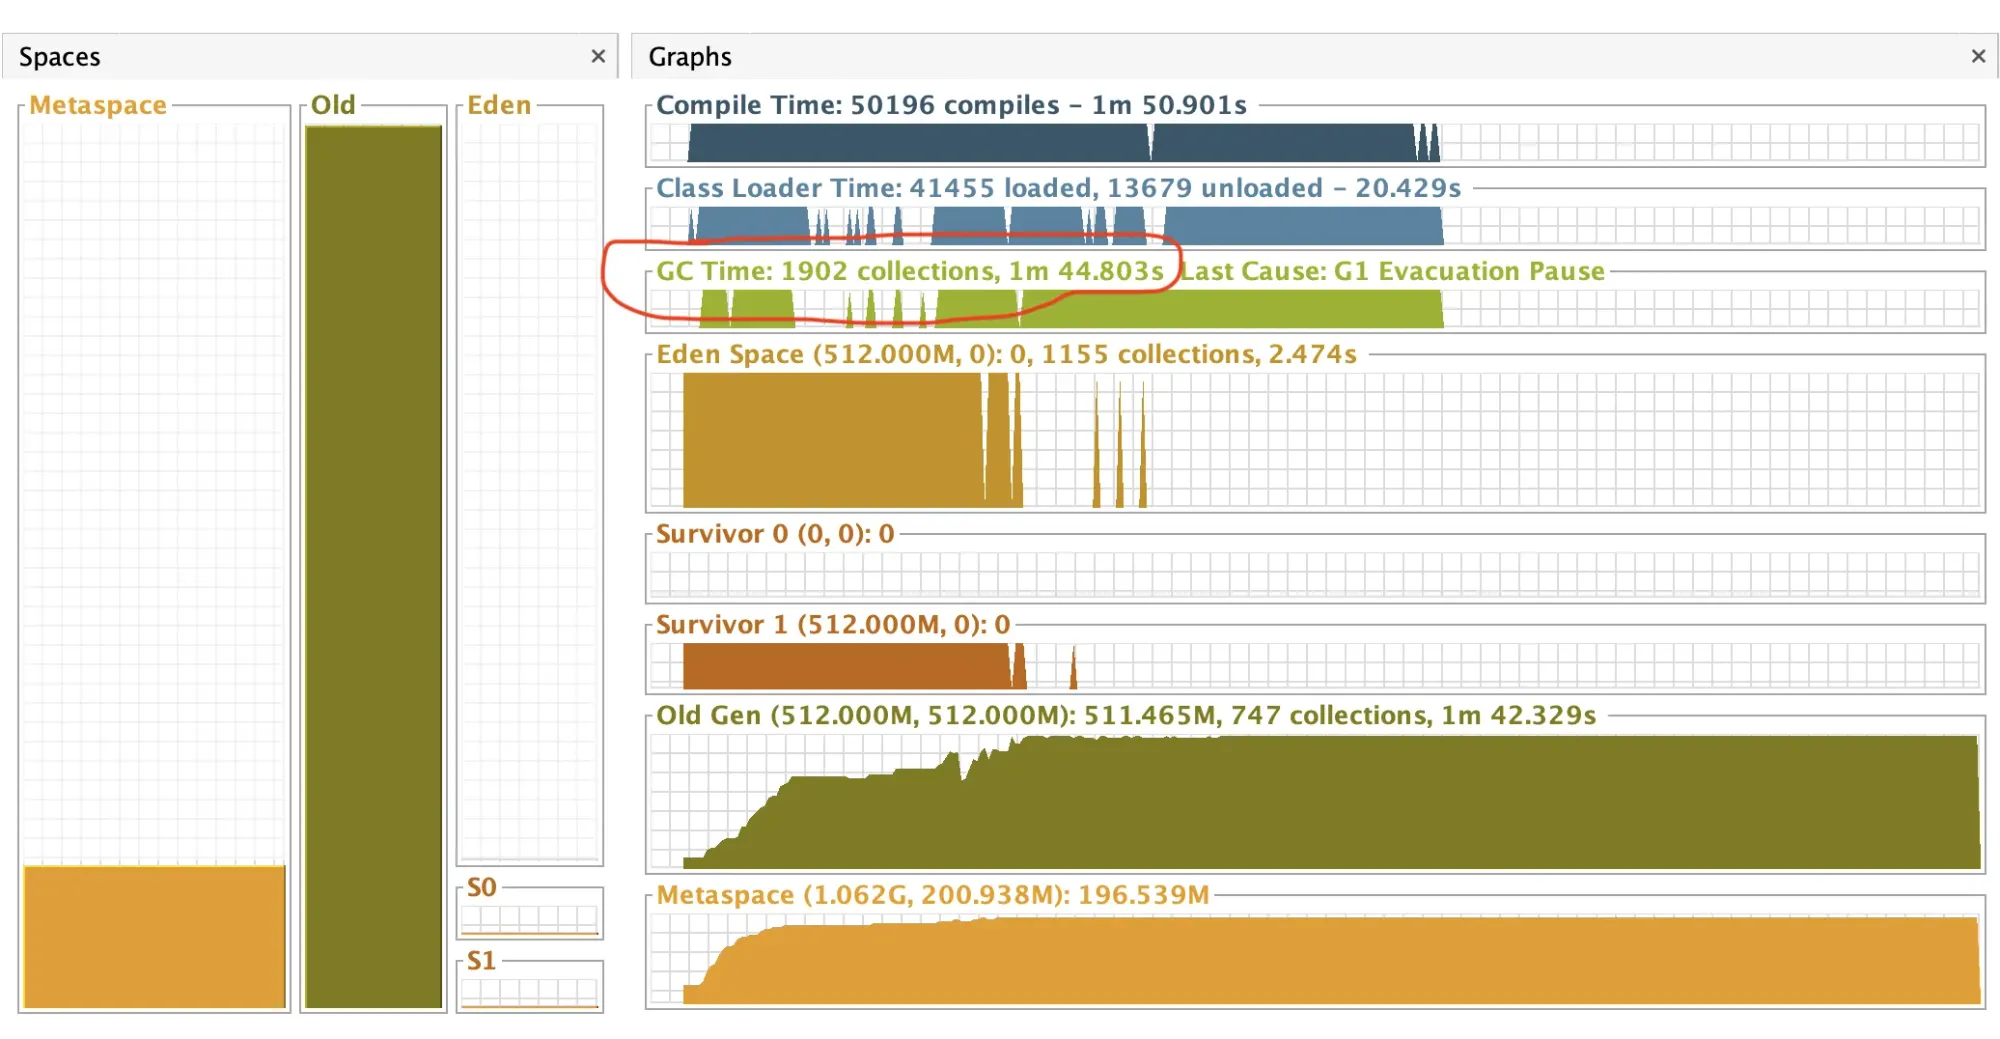
It can be seen here that the GC ran 1902 times, taking 1 minute and 40 seconds.
So, with a high degree of probability, it can be stated that excessive memory demand, along with insufficient memory in the tests, causes very high GC activity (which increases overall CPU usage) and tests that last indefinitely because threads cannot get space in memory to load the necessary classes.
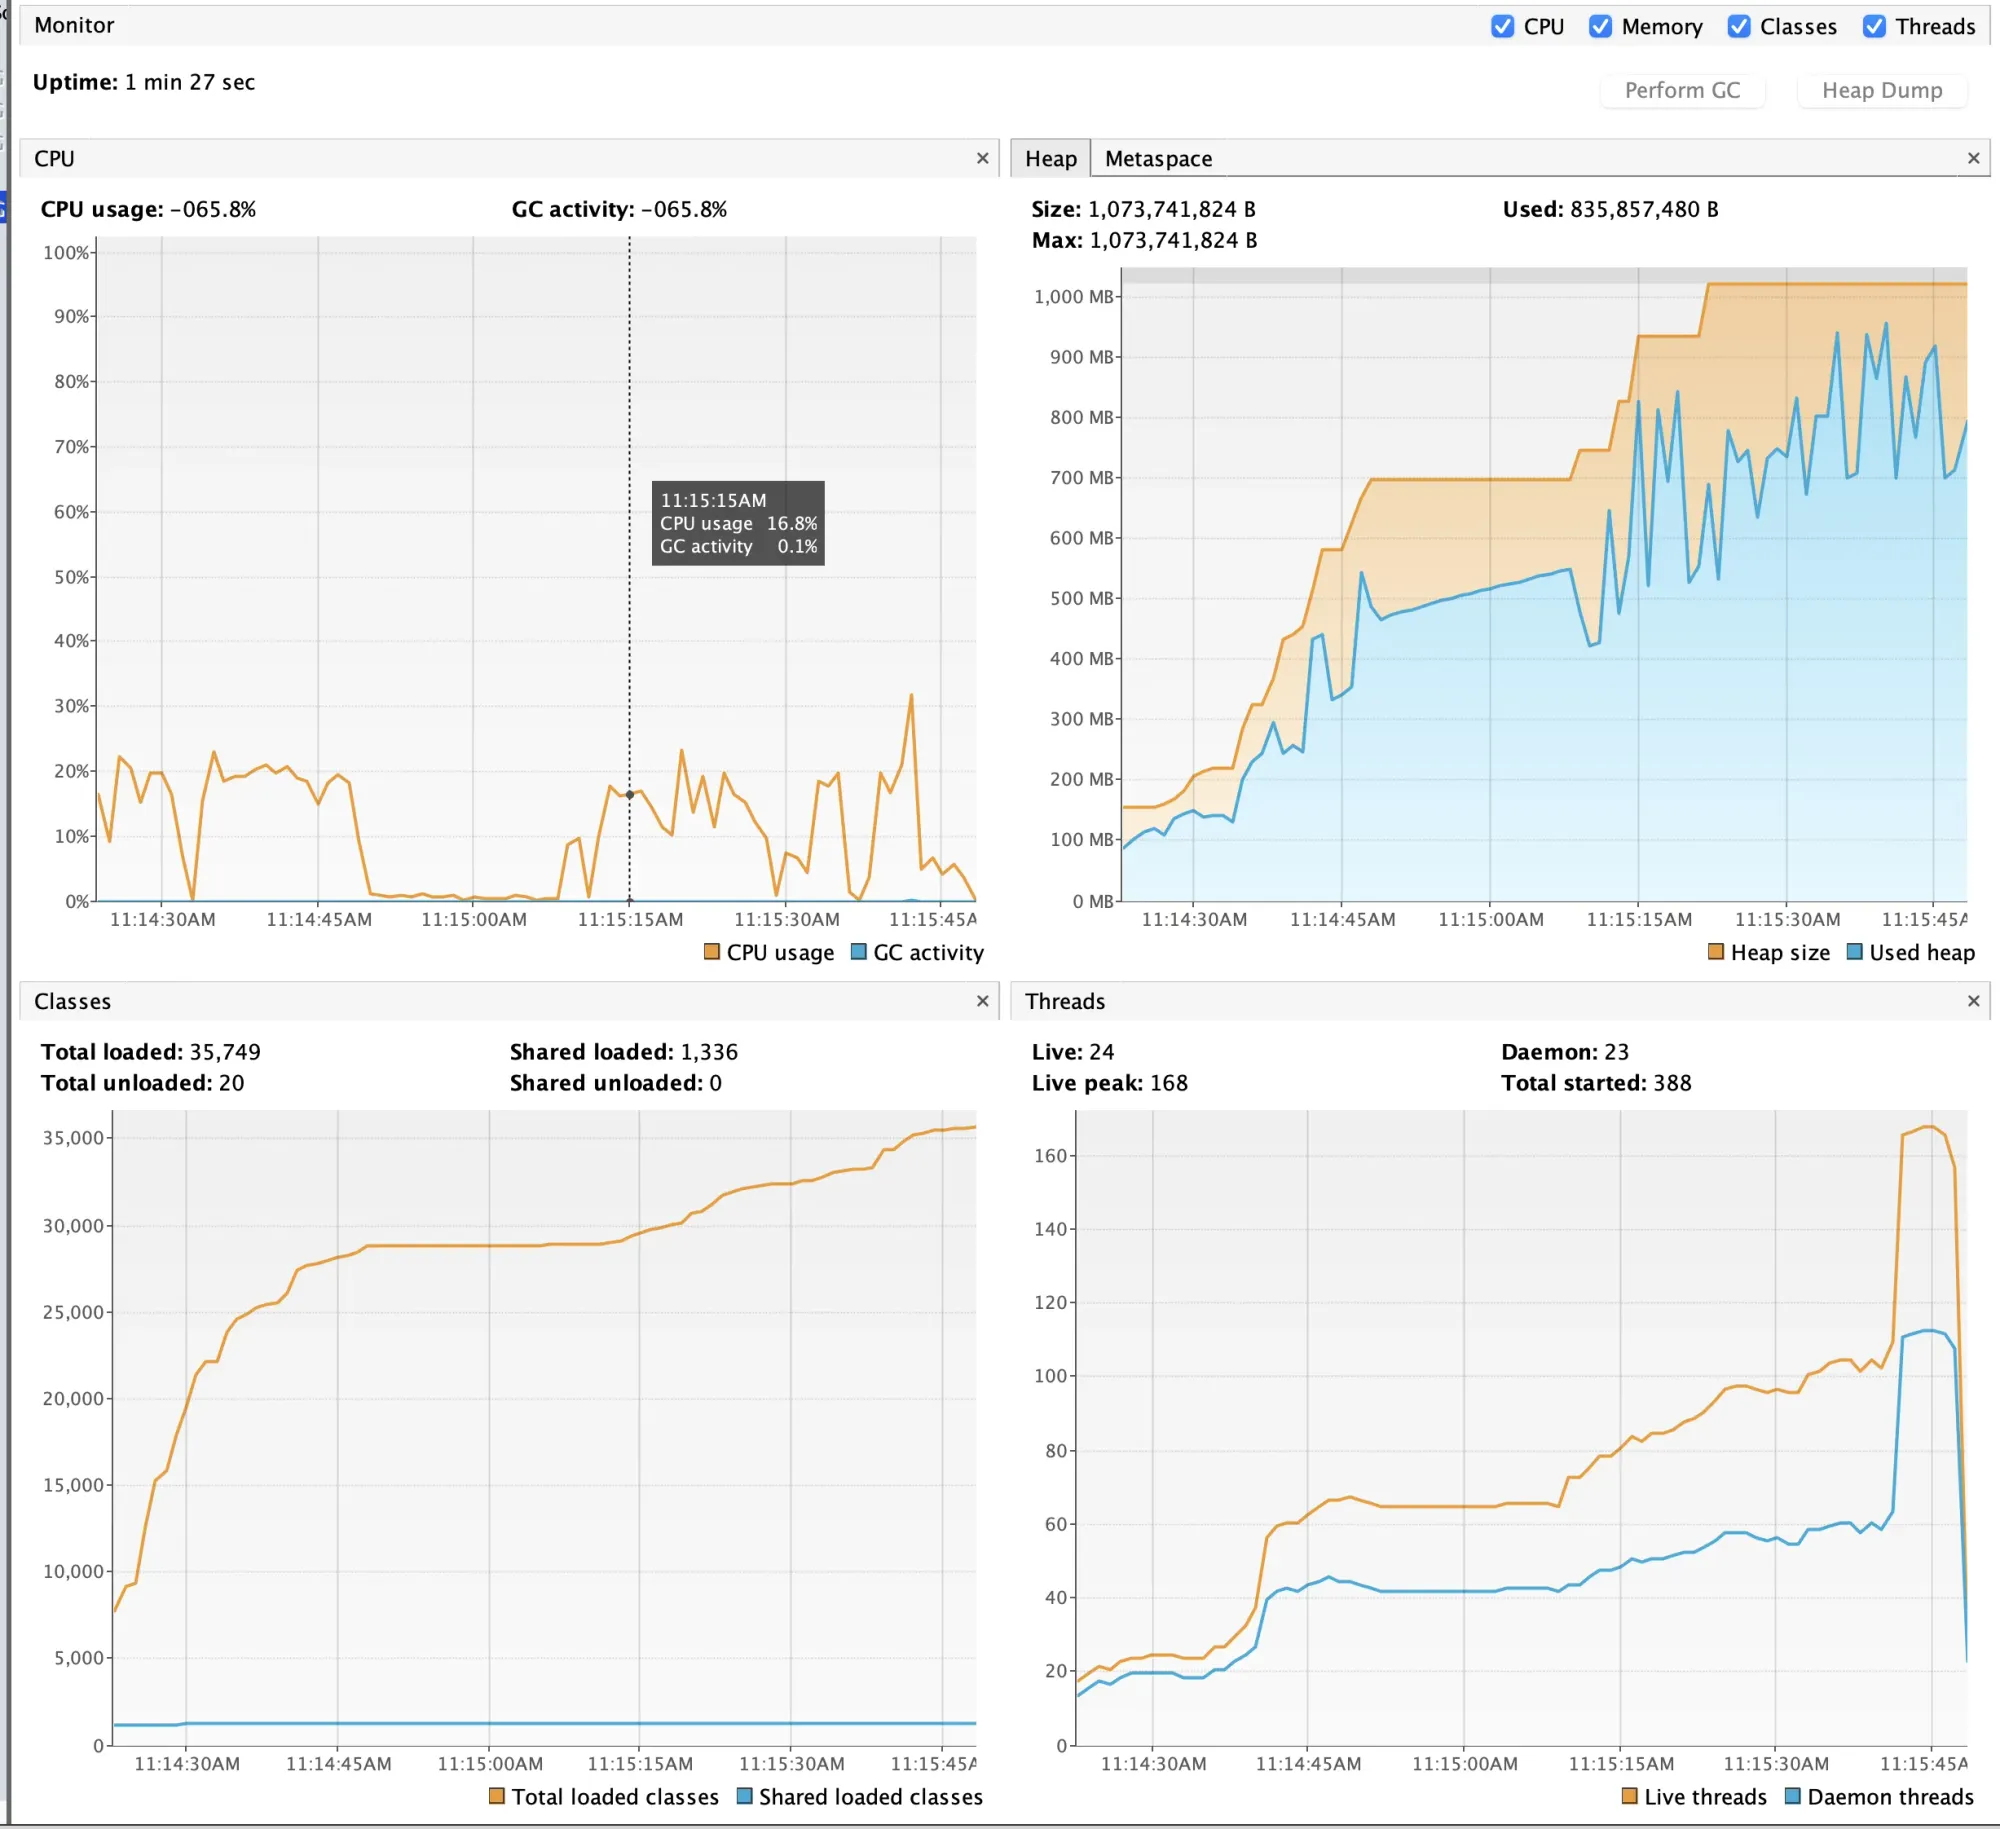
Intermediate Solution
Increasing the RAM in the tests from 512 (default) to 1g caused the tests to pass correctly, and the whole process took about 1 minute and 30 seconds, with GC activity at 0.2%. Overall CPU load has also decreased.
GC details look like this.
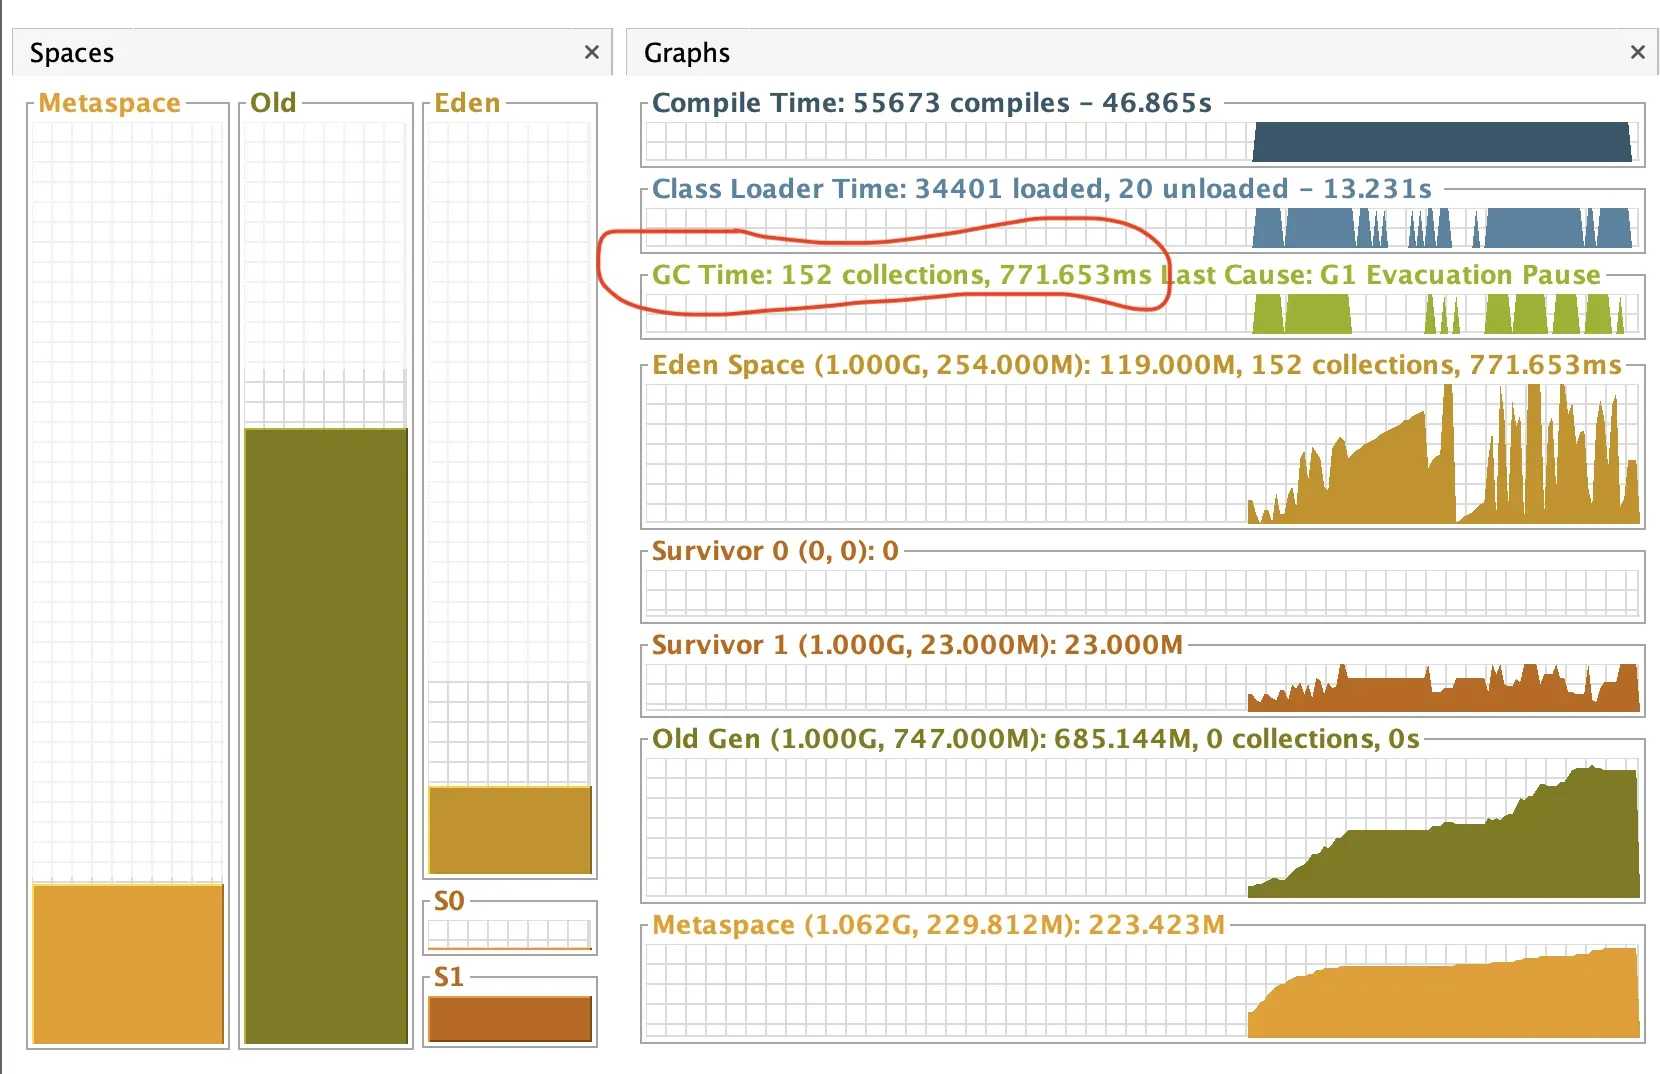
This time the GC ran only 152 times (previously 1902) and it took only 770ms (previously 1 minute 40 seconds)
So why did the forks work?
Considering what I wrote above, the forks worked because each of the 8 forks received 512mb of RAM and had enough to fit all the Spring contexts and classes that were loaded into the JVM.
Disclaimer
Of course, this is not the ideal final solution, but now that we know the cause, increasing the RAM allows us to move forward with production tasks while gradually cleaning up the test configurations.
Summary
In this post, I shared my latest problem with long-running tests. After adding custom OpenTelemetry tracing instrumentation to the OrderService, I faced the challenge of slow and infinite tests runs, which initially took around 8 minutes for 1,020 tests. The issue stemmed from an excessive number of Spring test contexts and high CPU usage, particularly with a Kafka test that caused everything to hang.
Through investigation, I discovered that increasing the number of JVM forks drastically improved performance, cutting the test runtime down to just 45 seconds. However, I wanted to dig deeper and find the root cause. Using VisualVM, I identified excessive memory demands and high garbage collection activity as the culprits (due to high memory demands caused by multiple Spring contexts). By increasing the test memory allocation from 512MB to 1GB, I managed to resolve the issues, bringing the test duration down to about 1 minute and 30 seconds.
While this increase in RAM offered a temporary fix, I recognize that there's still work to be done in cleaning up the test configurations for long-term efficiency.